Reports
What sold, at what hour, on whose shift
Most café owners can tell you last month's takings and nothing else about last month. These are the numbers underneath that one — and they are in your currency, on your clock, cut on your trading day rather than somebody else's midnight.
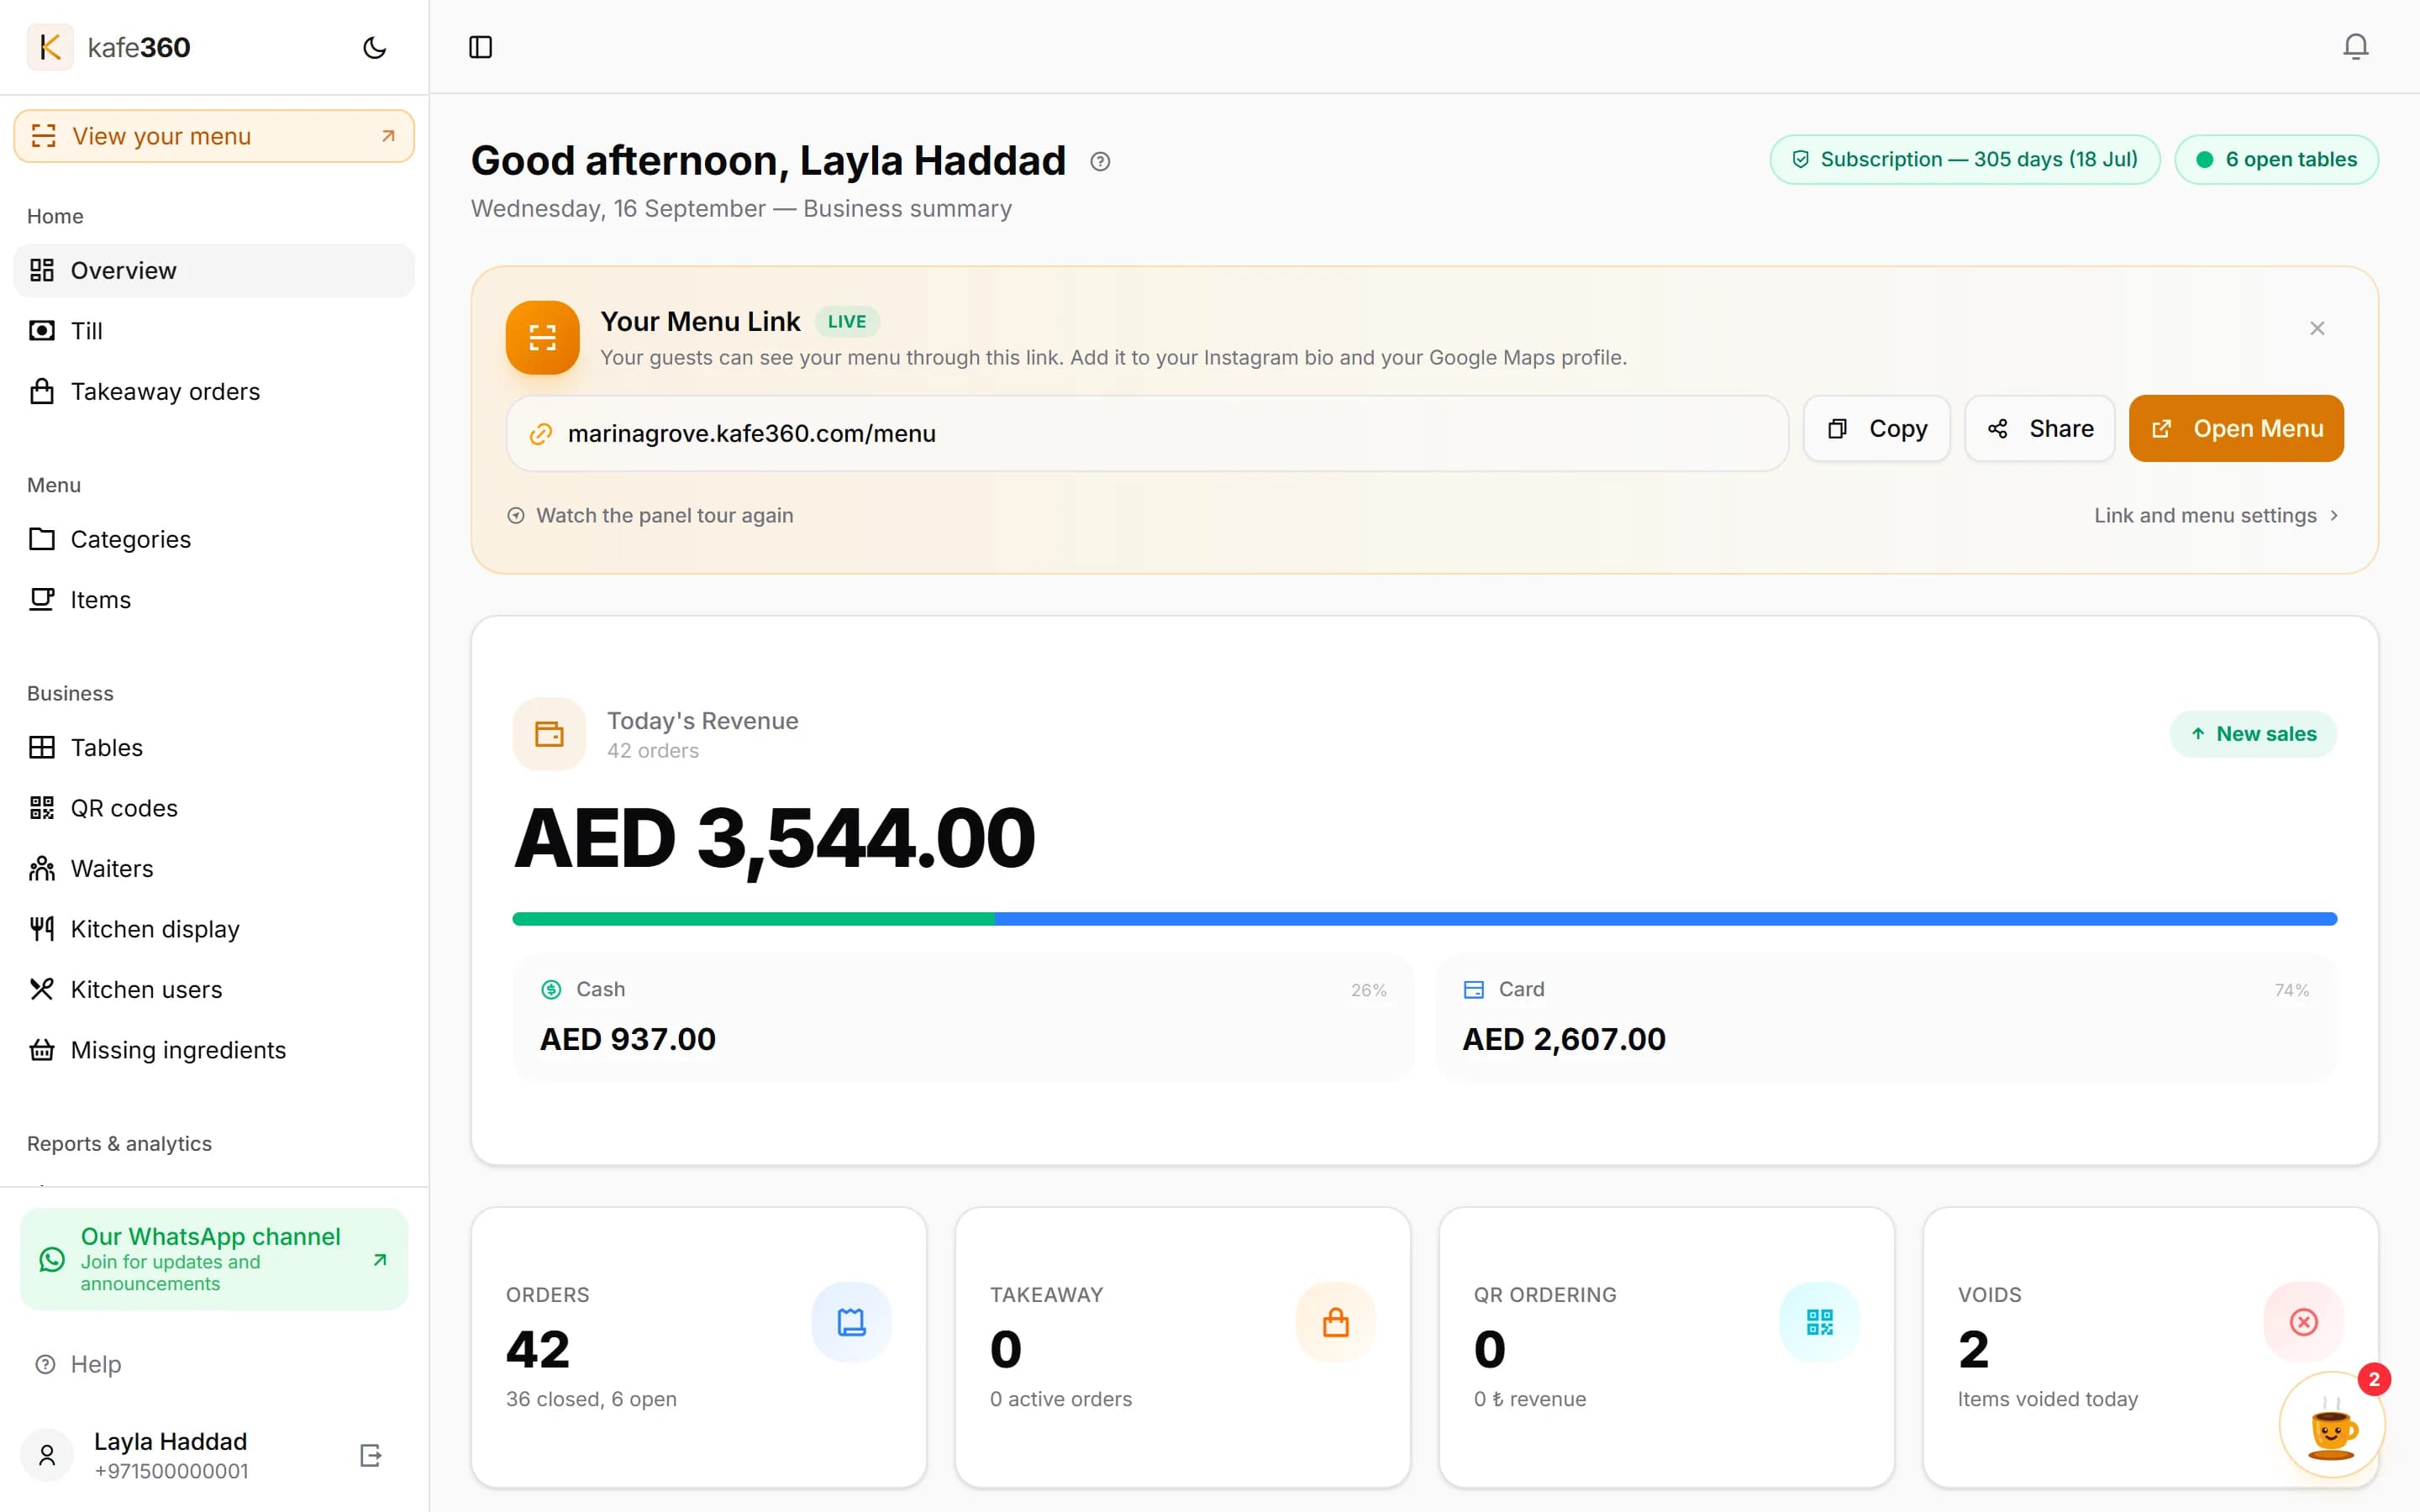
Before you take your coat off
One screen that answers the first six questions
The dashboard is the page you land on. It updates as service happens, so you are not refreshing it to find out whether the evening has started.
- Today's revenue, split into cash, card and house accounts
- How today compares with yesterday, as a percentage
- Orders closed and still open, and how many tables are in use
- Items guests ordered themselves by QR, and what they came to
- Items voided today, before the number gets buried
- An hourly column chart, a payment breakdown and a seven-day trend line
The reports themselves
Six tabs, and each one answers a question you have already asked
Items sold
Best sellers by quantity and by revenue, and the ten that barely move. Revenue by category on top, and what your modifiers and extras added on their own.
Hourly sales
Every hour of a chosen day as a stacked bar, and a thirty-day summary table above it you can click straight into. This is how you decide who starts at four.
Waiter stats
Orders taken, payments handled, sales and voids per waiter over any date range, ranked. It settles arguments that would otherwise be settled by whoever is loudest.
Voids
Cancelled bills and individually cancelled items, with who cancelled and when. The analysis view groups them by reason, by waiter, by product and by hour.
Price changes
Every price altered by hand at the till or during ordering — who did it, the menu price and the price charged. Worth ten minutes a week of anyone's attention.
End-of-day report
A saved snapshot of a day's takings, payment split, order count and voids, filed under that date and kept. One per day, and the list keeps the last thirty.
And four more for the week you decide to look properly
These sit on their own pages because nobody needs them daily. They are the ones that change how a place is run.
Averages
Average bill, average revenue per table, average spend per cover and how long an order stays open from opening to closing. Four numbers that tell you more about a venue than its total.
Period comparison
Pick two date ranges and see revenue, order count, average bill and voids side by side with the percentage change. It defaults to the last thirty days against the thirty before.
Table analytics
How long guests sit, at which tables and in which section; how many times a table turns in a day; and an hour-by-weekday heatmap of when you are actually busy.
House accounts
What is owed to you in total, who owes the most, and how much was charged versus collected over the last thirty days.
Where the numbers land
A report is worthless if the day it covers is the wrong day
Your currency, not a conversion
A venue set to the UAE reads AED 1,250.50 — symbol in front, comma thousands, two decimals always. Nothing is converted from anything; the figures are the dirhams that went through your till.
Your clock and your calendar
Dates as 15/09/2026 and times on a 12-hour clock, and every daily total cut on Asia/Dubai rather than a European office's midnight.
Your day, not the calendar's
If you serve until two in the morning, set the day to start at six. A 01:30 sale then belongs to the night it was part of, in every report and on that night's end-of-day snapshot.
What this is not
A till, not an accountant
Reporting is the part of a POS where promises get vague. Here are the four things people assume are included and are not.
No food cost and no profit
Recipes deduct quantities from stock, but no ingredient carries a price. There is no cost of goods, no margin per dish and no profit and loss. Reports tell you what came in, not what it cost you.
No tax reporting
A tax line can be shown on a guest receipt, and that is the whole of it. There is no VAT return, no fiscal report and nothing to file. Your accountant's job stays your accountant's job.
Nothing is emailed to you
There is no scheduled digest landing in your inbox at nine. You open the panel and look — from home, from the car, from another venue.
Reports are not in the free plan
The free QR menu plan shows your menu to guests and stops there. Everything on this page is part of the paid system, which is what the 30-day trial gives you in full.
Questions people actually ask
- Do I have to be at the venue?
- No. The owner's view is a browser page like everything else. Check the floor from home at eleven at night, or from another country, on whatever you are holding.
- Does it work on a phone?
- Yes. The tab strip scrolls, tables drop their less important columns rather than squashing them, and the charts resize. It is a responsive panel rather than a separate app, which also means there is nothing to update.
- How far back can I look?
- As far as your data goes. Date ranges are free-form with presets for today, yesterday, the last seven and the last thirty days, and the end-of-day list keeps the most recent thirty snapshots.
- Is the end-of-day report an official document?
- No, and we will not pretend otherwise. It is your own saved snapshot of a day's trading, useful for cashing up and for arguing with your own memory. It is not a fiscal record and it is not connected to any tax authority.
- Can I get the raw numbers out?
- A full export of your data — orders, payments, items, end-of-day snapshots, stock, house accounts — as CSV files inside a single ZIP can be switched on for your account. There is no per-report Excel button.
- Can I hide the takings from staff who use the till?
- Ask us. There is a lock that hides revenue behind a PIN, but part of it currently depends on SMS verification that we do not operate in the UAE, so we would rather talk it through than sell you something half-connected.
Give it a month and read your own numbers
Thirty days of real service produces a real hourly chart, a real best-seller list and a real void report. Then decide.